Motion of Emotion ProjectIn this project we had to pick a graph that we desired and then we had to make a poem with emotion to match the graphs acceleration. Then, we had to make a poster stating our reflection of our project and make a graph showing what part of our poem matches the graph we did originally. Not only did we have to match our poem to a graph, we had to make another graph of our own and for the y axis of the graph we used adjectives that increased in intensity. For example, "sad would be 1 and 5 would be depressed". Then, for the x axis side we showed the time at which the poem escalated in emotion.
|
Graph we based the poem off of and then the graph we made of our
poem measuring the intensity with words.
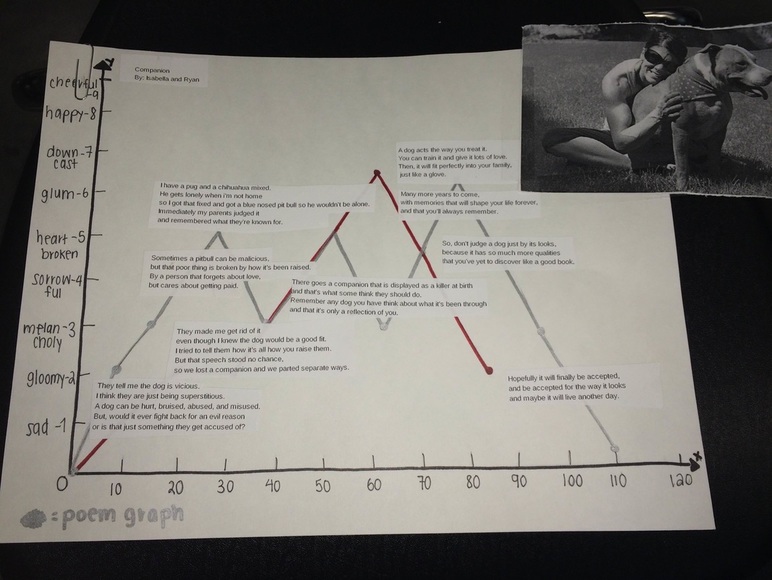
This is our graph that shows our graph that we made with the intensity words AND the graph that we chose in the beginning to base our poem off of. Also, we placed the text on the graph to show where in the poem the emotion escalated. For example, at 1 on the y-axis we used sad to measure where the least intense part was, which was "They tell me the dog is viscous but I think they're just being superstitious..." The intensity raises as the numbers get higher.
